The iBox report contains the results of the iBox algorithm calculation: probability of graft survival at 3, 5 and 7 years.
1. Generate an iBox evaluation
✅ To create an iBox assessment, from the list of patients, select a patient to open his or her file.
✅ In the section "List of iBox", you can create an iBox report by clicking on: ![]()
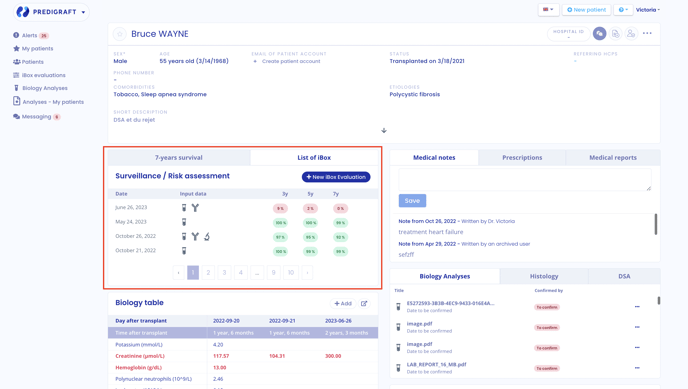
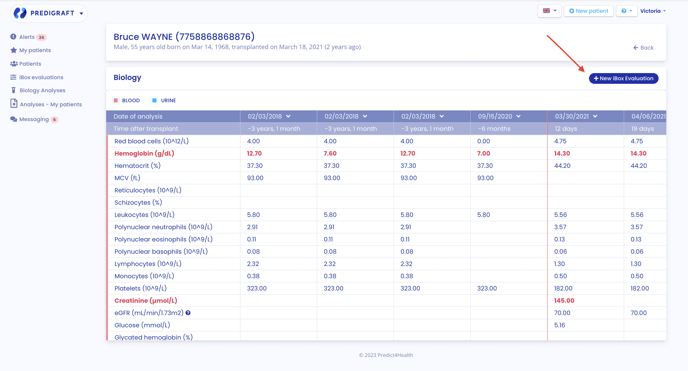
✅ You can also generate a new iBox evaluation from the biological table. To do this, click on "Biology table", then on the button ![]() at the top right of the table.
at the top right of the table.
⚠️ Fill in the form step by step, making sure all mandatory fields are filled in before moving on to the next step.
2. Create an iBox report
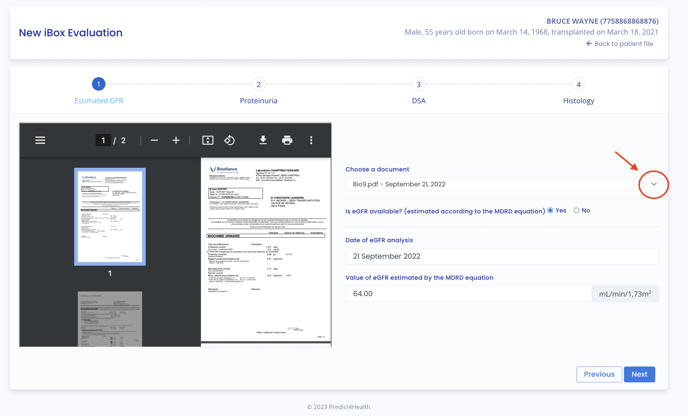
☑️ Step 1: Enter estimated glomerular filtration rate (eGFR) value
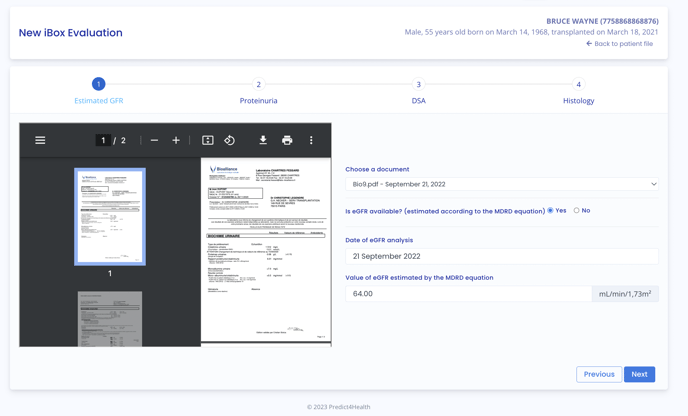
The biology report with the most recent date is displayed by default. To select another report, click on the arrow, and a drop-down menu will appear with all the biological analysis reports relating to the patient.
If you wish to perform an iBox evaluation with data other than the imported PDFs, select "Not available" from the drop-down menu.
☑️ Step 2: Enter the proteinuria value
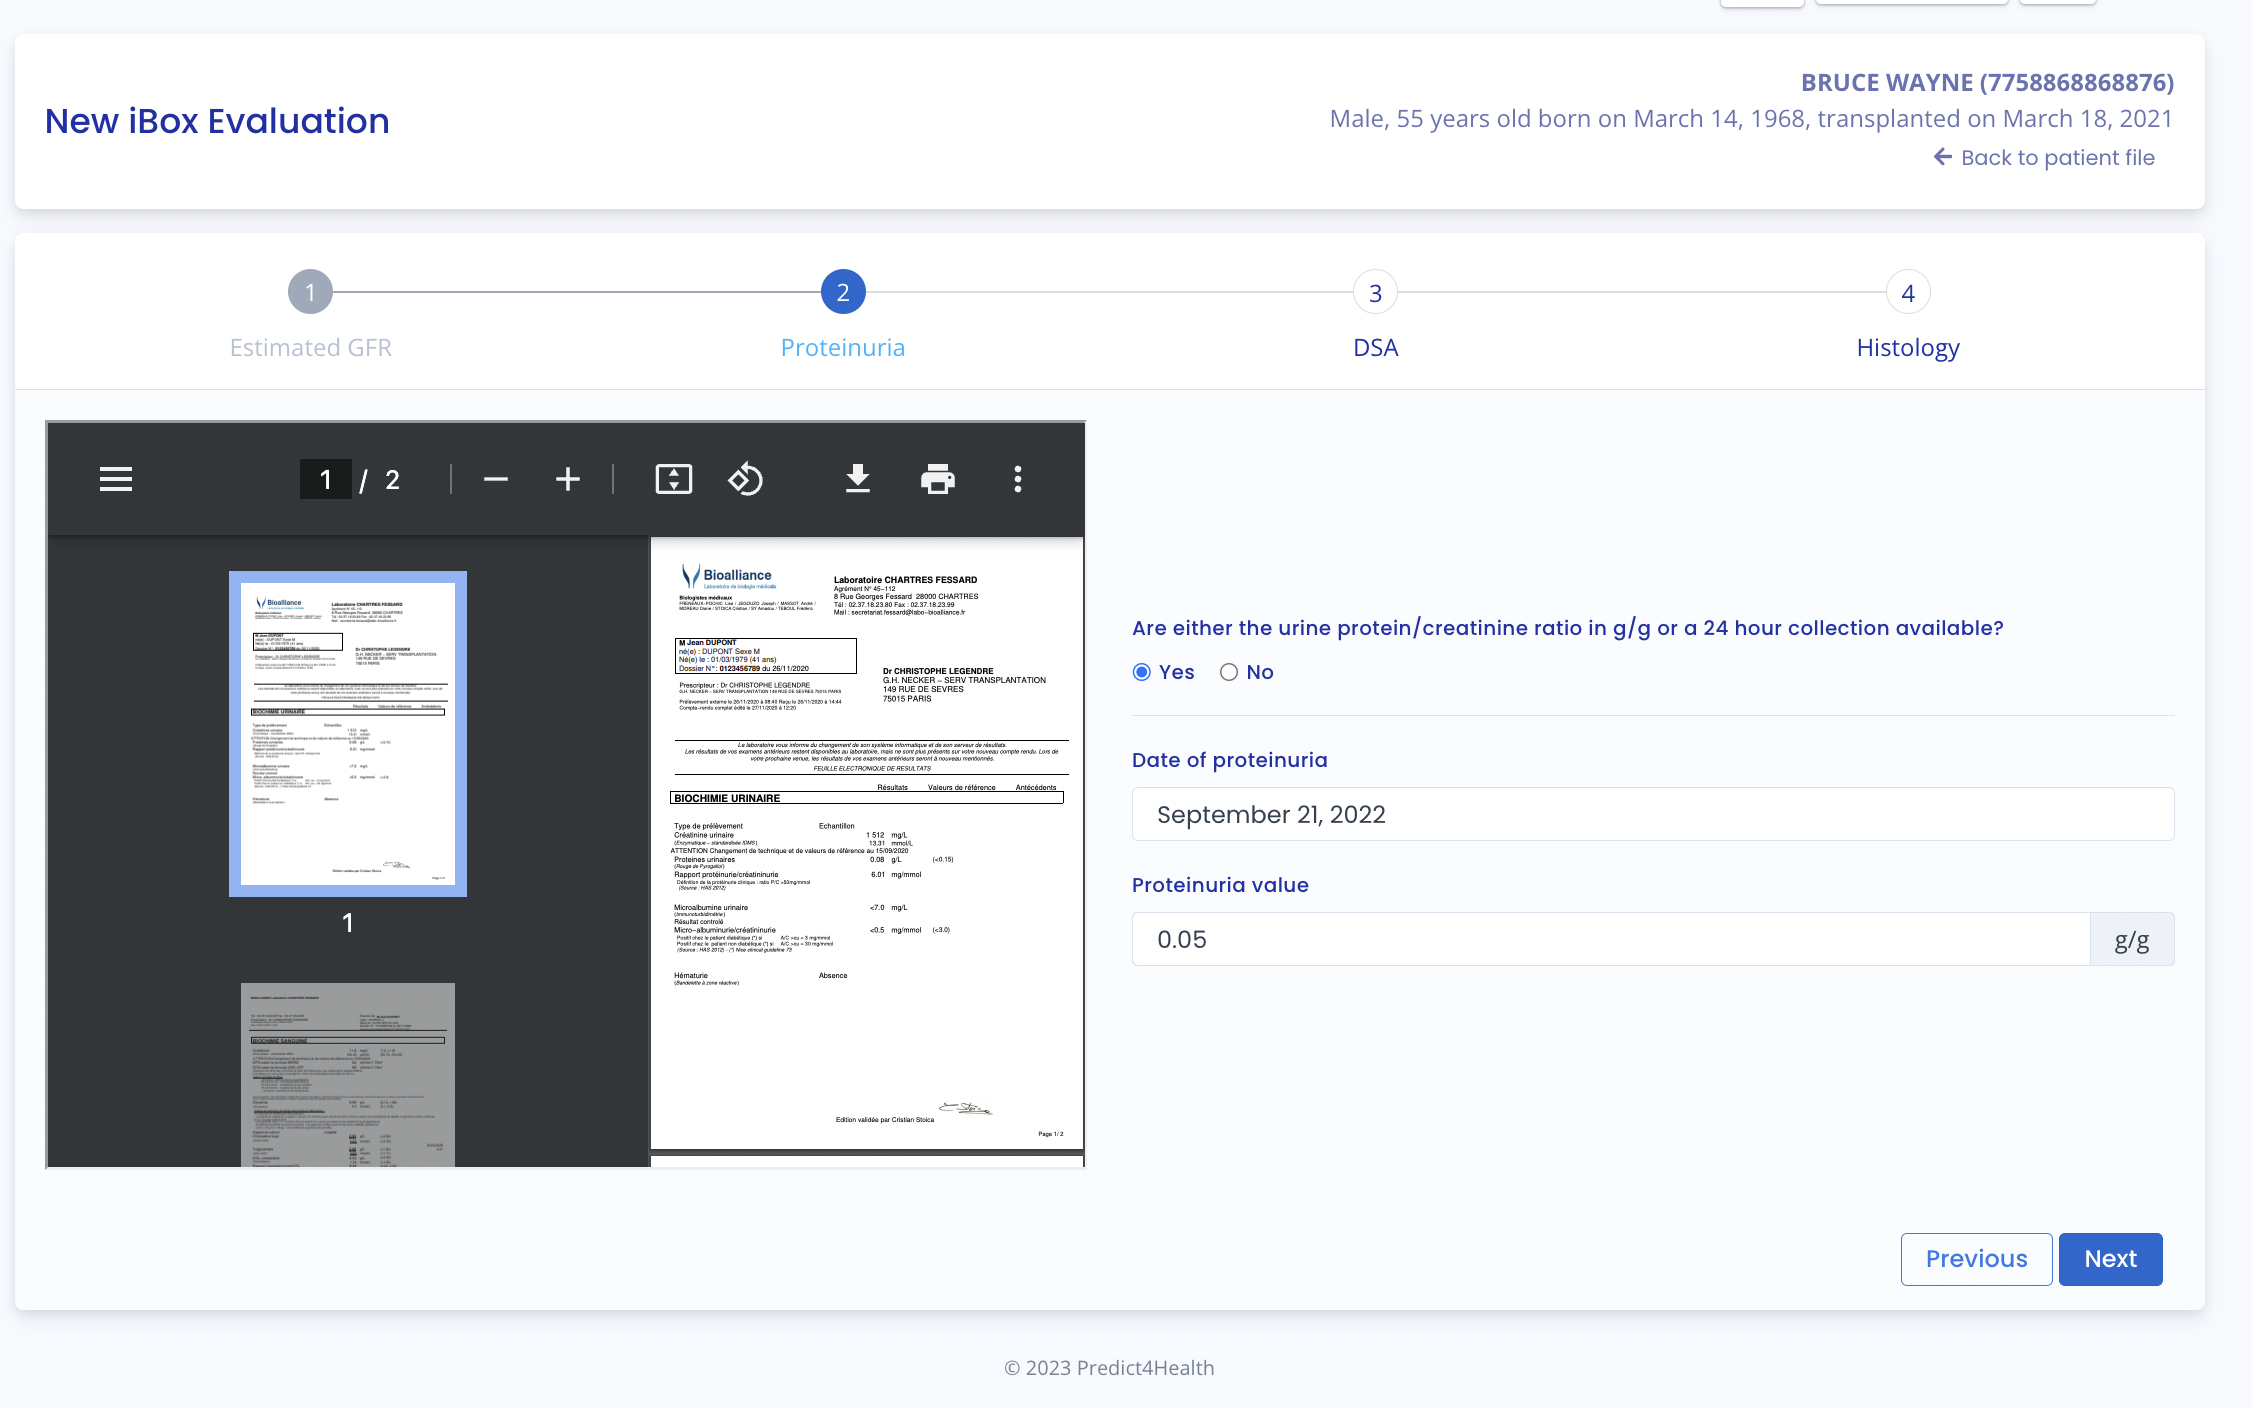
For steps 1 and 2, if you have already validated biological analysis documents on the patient record, then these data will be pre-filled when you create the iBox report. If you modify these data, they will be automatically modified in the biological table.
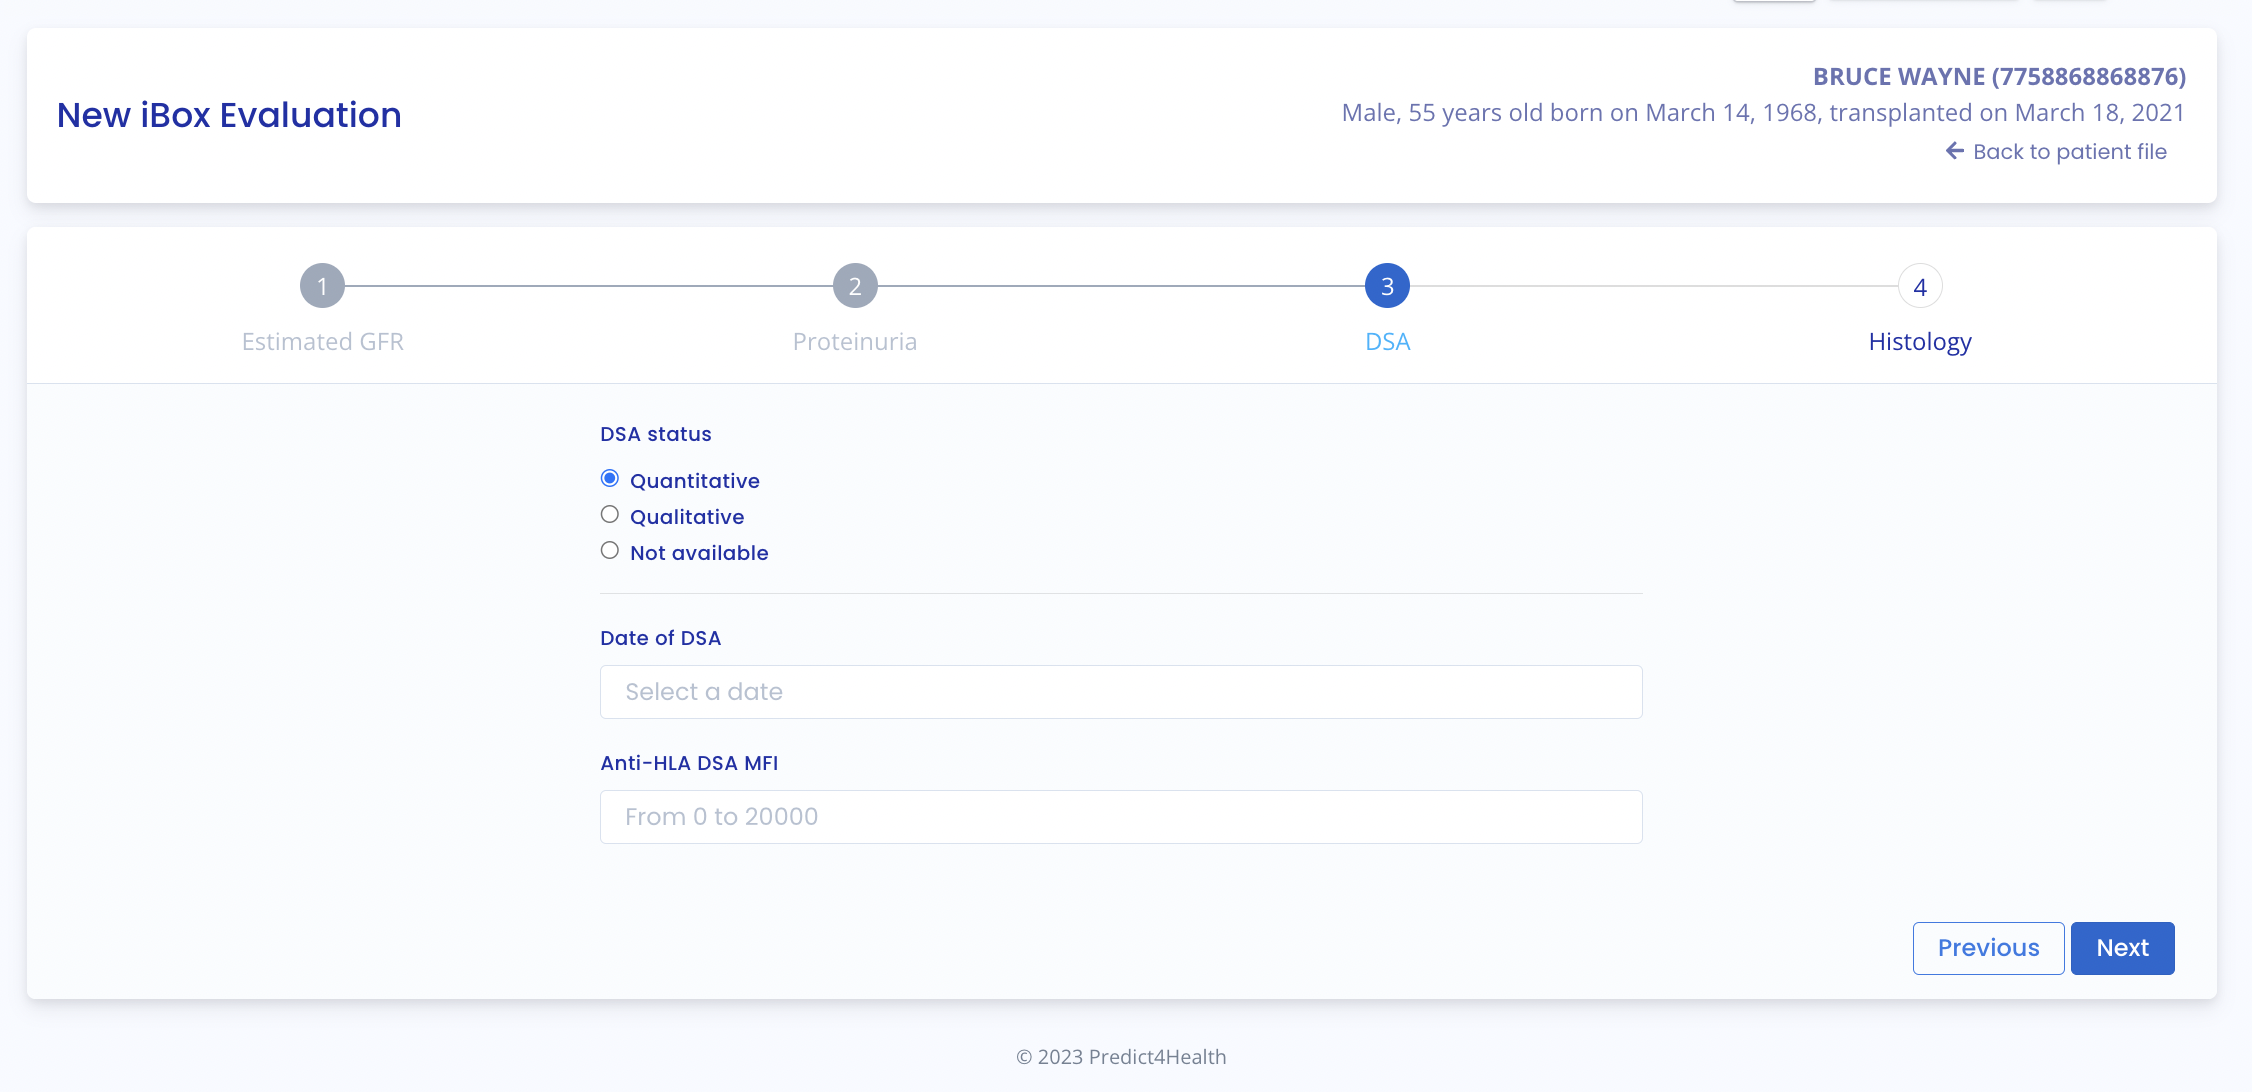
☑️ Step 3: Enter the DSA value if available; if not, tick "Not available"
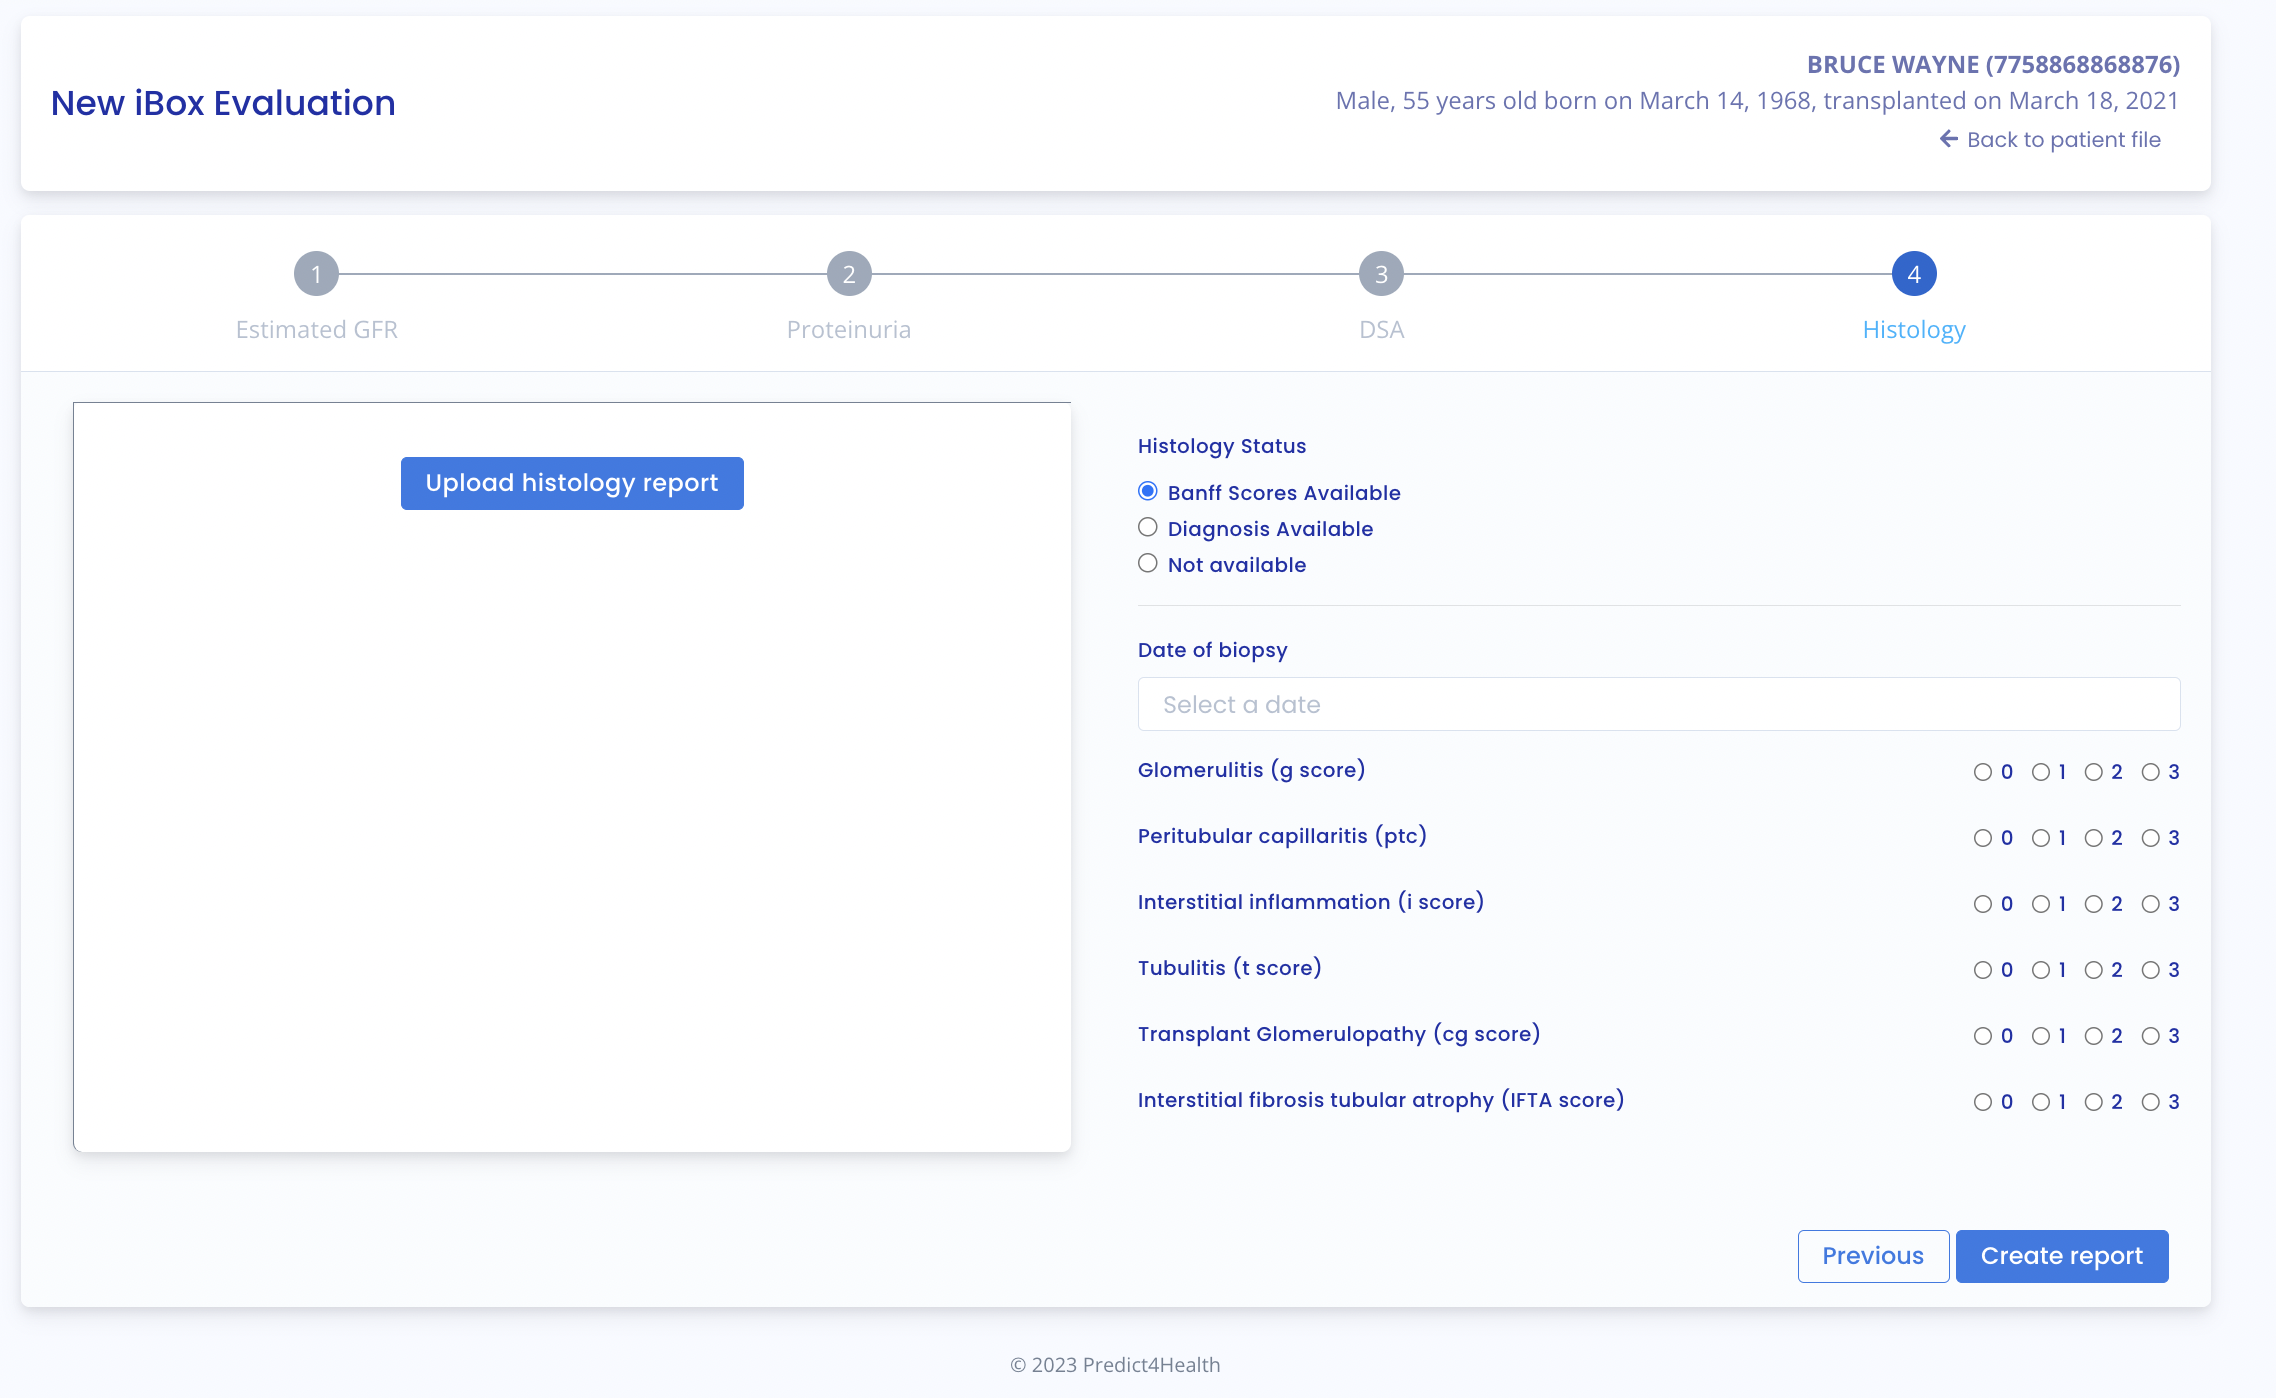
☑️ Step 4: Fill in histological information if available (Banff score or available diagnostics), if not, tick "Not available".
3. Displaying iBox results
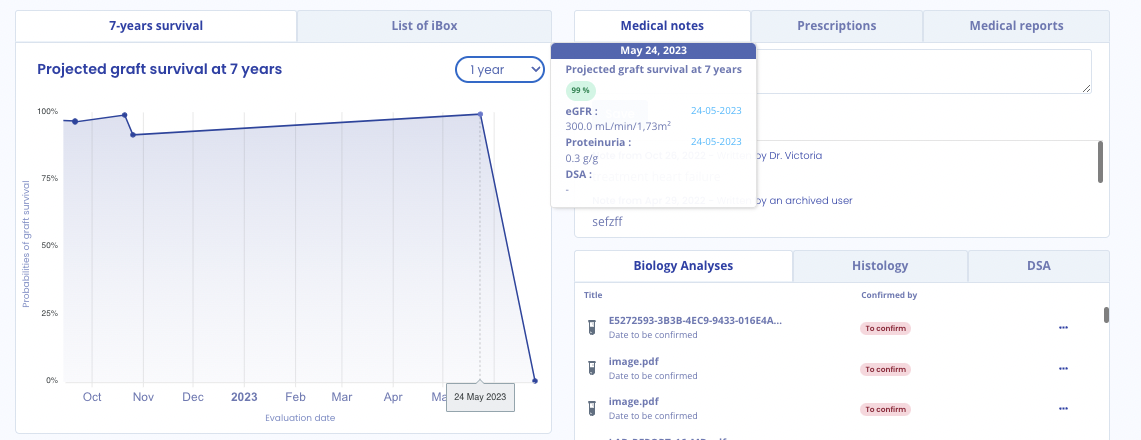
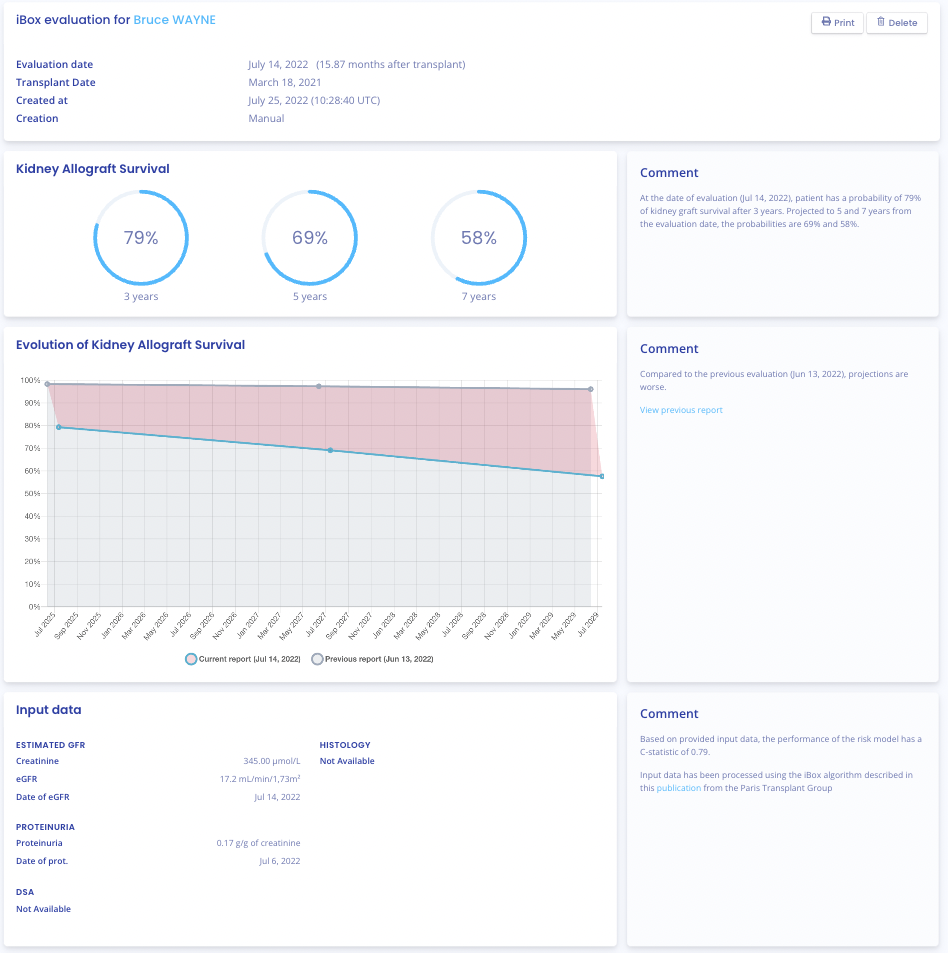
You see the results of the iBox calculation: the projected kidney allograft kidney probability survival at 3 years, 5 years and 7 years from the assessment date. The "Comment" panel describes the probabilities.
You see the iBox results of the current report compared with the results of the previous report (with the earliest evaluation date). The "Comment" panel describes whether survival probabilities have improved or decreased since the previous report.
You can view the input data used to generate the report: the date and value of each report creation step (Estimated GFR, Proteinuria, DSA, Histology). In the "Comment" panel, you'll find the probability of agreement of the iBox model used, given the input data (c-stat). You can click on the "publication" link to access the Paris Transplant Group publication on iBox.
✅ You can print out the iBox evaluation by clicking on "Print".
✅ If you have created the iBox evaluation by previewing a biological analysis report, you can download the biological analysis report.
✅ You can delete the report by clicking on "Delete" and specifying the reason in the confirmation window that appears:
- Incorrect data,
- The patient is the wrong one,
- This report is a duplicate.
Tip: when you move your computer mouse over the iBox diagram, you can discover a pop-up window on the points of the graph.